Traefik with Kamal: Tips and Tricks

It took me some time to finally figure out Traefik and some more time to put two and two together, so I'd like to share some things I learned on how to get it to work smoothly with Kamal.
Traefik is a powerful and fun tool, but there is a learning curve. It is not steep, but it is there. There are 3 components that make Traefik work: Entrypoints, Routes, and Services. When you understand how they work together, there is a feeling like "duh, obviously," but it didn't click for me until I actually saw it coming to life.
Misconceptions
Most tutorials will tell you to set a couple entrypoints like this:
entryPoints.web.address: ":80"
entryPoints.websecure.address: ":443"

entryPoints.web.http.redirections.entryPoint.to: websecure
entryPoints.web.http.redirections.entryPoint.scheme: https
entryPoints.web.http.redirections.entrypoint.permanent: true
And then redirect it to your web app like this:
servers:
  web:
    hosts:
      - web
    labels:
      traefik.enable: true
      traefik.http.routers.app.rule: Host(`example.com`)
      traefik.http.routers.app.entrypoints: websecure
This is correct and works fine, but I wanted to set up a Grafana dashboard, and my first idea was that I needed more entrypoints. While yes, you could definitely have more entrypoints, you don't need them. Ideally, what you want is to manipulate the server exposure via routes and services.
Here is how it works: the request to example.com comes through the entrypoint 80 or 443, Traefik then first redirects to 443 (if needed) and then searches the entrypoint called websecure, relaying the request to that server, in our case, the web app.
And here is where my confusion started: I thought I needed to do the same for Grafana; I would need to expose Grafana on another port, add an entrypoint to that port/server, and so on.
The answer is: no, you don't need it.
Let me show you how you can expose Grafana (or whatever you want) on a subdomain without extra entrypoints
Services and routes
First, there's one thing I find indispensable to dealing with Traefik: their internal API dashboard. Luckily, it is extremely easy to expose it so let's do that
First, let's update our Traefik configuration, and then I will explain what each thing does:
traefik:
  image: traefik:v3.0.0-beta5
  options:
    publish:
      - "443:443"
    volume:
      - "/letsencrypt/acme.json:/letsencrypt/acme.json"
  args:
    api.dashboard: true
    # accesslog: true
    log.level: INFO
    accesslog.format: json
    accesslog.filters.statusCodes: "400-599"
    accesslog.filters.retryAttempts: true
    accesslog.filters.minDuration: 101ms

    entryPoints.web.address: ":80"
    entryPoints.websecure.address: ":443"

    entryPoints.web.http.redirections.entryPoint.to: websecure
    entryPoints.web.http.redirections.entryPoint.scheme: https
    entryPoints.web.http.redirections.entrypoint.permanent: true
  labels:
    traefik.enable: true
    traefik.http.routers.dashboard.rule: Host(`traefik.sumiu.link`)
    traefik.http.routers.dashboard.service: api@internal
    traefik.http.routers.dashboard.middlewares: redirect-to-https, auth
    traefik.http.routers.dashboard.tls: true
    traefik.http.middlewares.redirect-to-https.redirectscheme.scheme: https
    traefik.http.middlewares.auth.basicauth.users: xxxXXXXxxxx
We start the customization by updating args and setting api.dashboard: true so that Traefik starts the internal dashboard service.
Next, we need to expose it. I'm gonna do it on a subdomain traefik.sumiu.link:
labels:
  traefik.enable true
  traefik.http.routers.dashboard.rule: Host(`traefik.sumiu.link`)
  traefik.http.routers.dashboard.service: api@internal
  traefik.http.routers.dashboard.middlewares: redirect-to-https, auth
  traefik.http.routers.dashboard.tls: true
  traefik.http.middlewares.redirect-to-https.redirectscheme.scheme: https
  traefik.http.middlewares.auth.basicauth.users: xxxXXXXxxxx
Here's how we manipulate the routers and services to expose things without having to add new entrypoints.
We started with setting traefik.enable true so Traefik itself is discovered by, well, Traefik.
Then, we create a new route called dashboard. The route name doesn't matter as long as it is unique. Here is where the magic happens, we bind the route to the service with two lines
traefik.http.routers.dashboard.rule: Host(`traefik.sumiu.link`)
traefik.http.routers.dashboard.service: api@internal
This essentially tells Taefik that every request that comes to traefik.sumiu.link should be redirected to api@internal. The next 3 lines will make sure we will always be under https. The last line is the username and password combination for the dashboard. You can check other auth options on the documentation
With that in place, the next thing you want to do now is set up DNS. I'm using Cloudflare, so I just have to add a CNAME record from traefik to sumiu.link:

That was when things clicked for me; being able to visualize the routes helped me a ton:
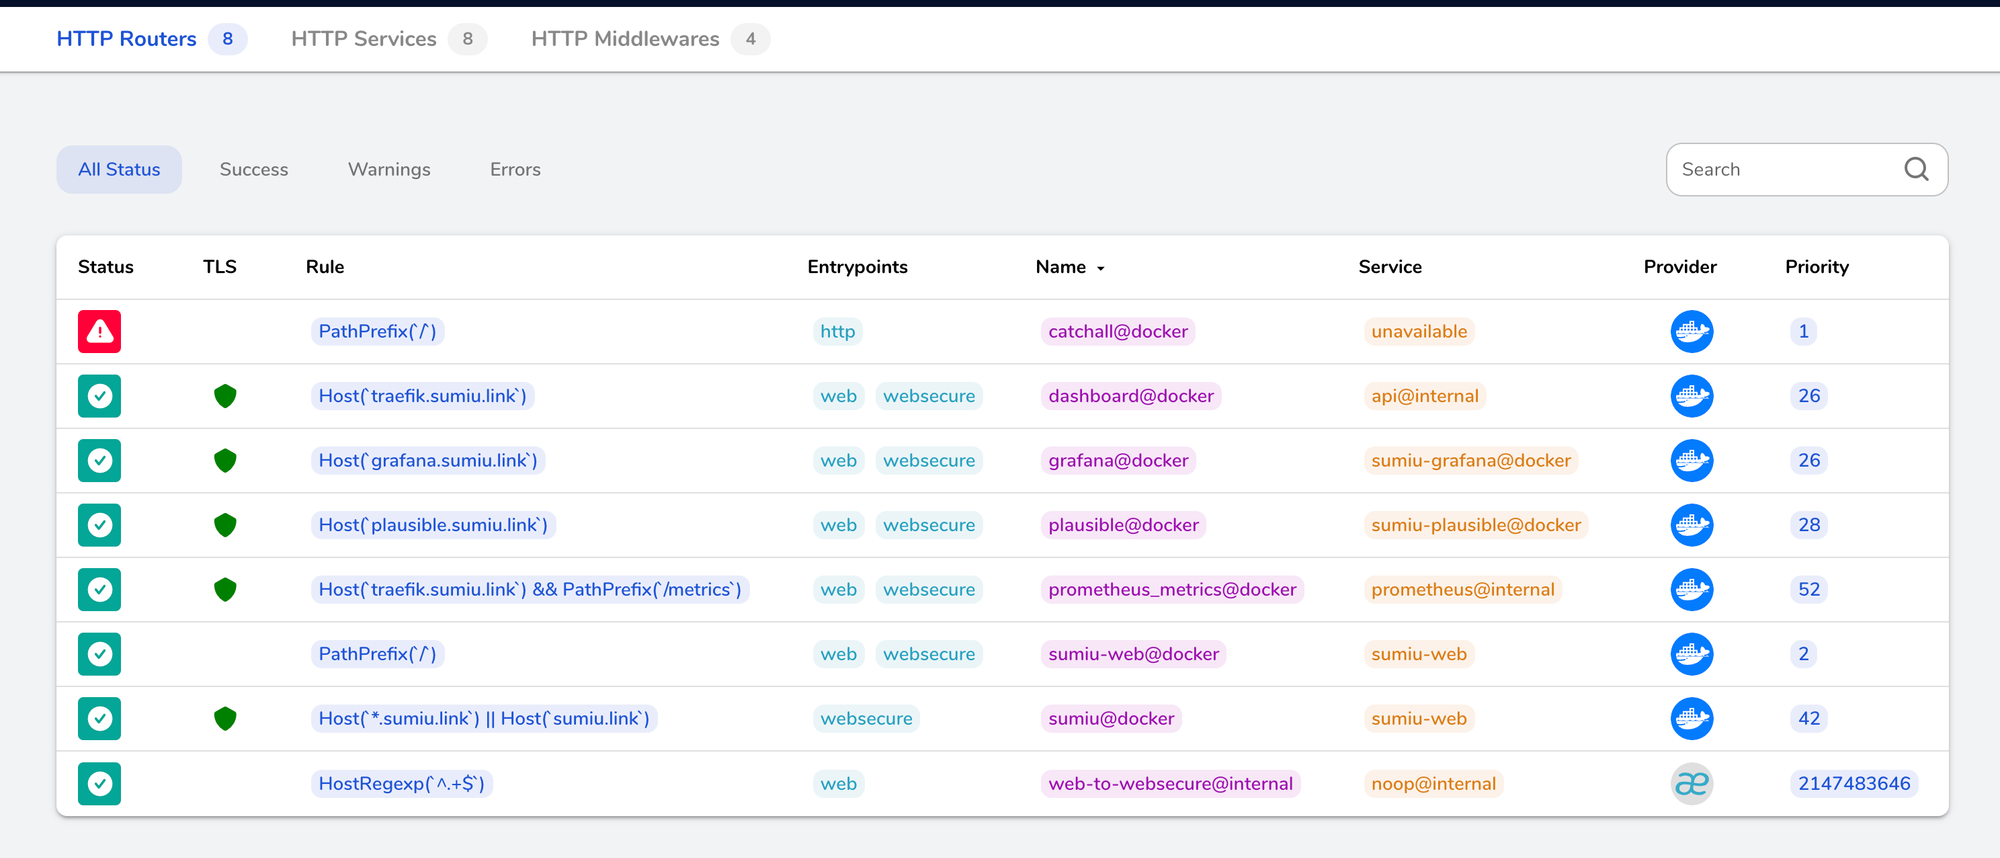
The Rule column lists the rules we set up. Notice that all of them point to the same entrypoint: web/websecure. Name column is the name of the route, which will usually be #{route}@#{provider} where provider is docker. Then there's the service. If the service was set up by Kamal, using either server or accessory, the service name will be prefixed by the service key defined in deploy.yml.
Clicking on a router will show the path needed to match that service, for example, with Grafana:
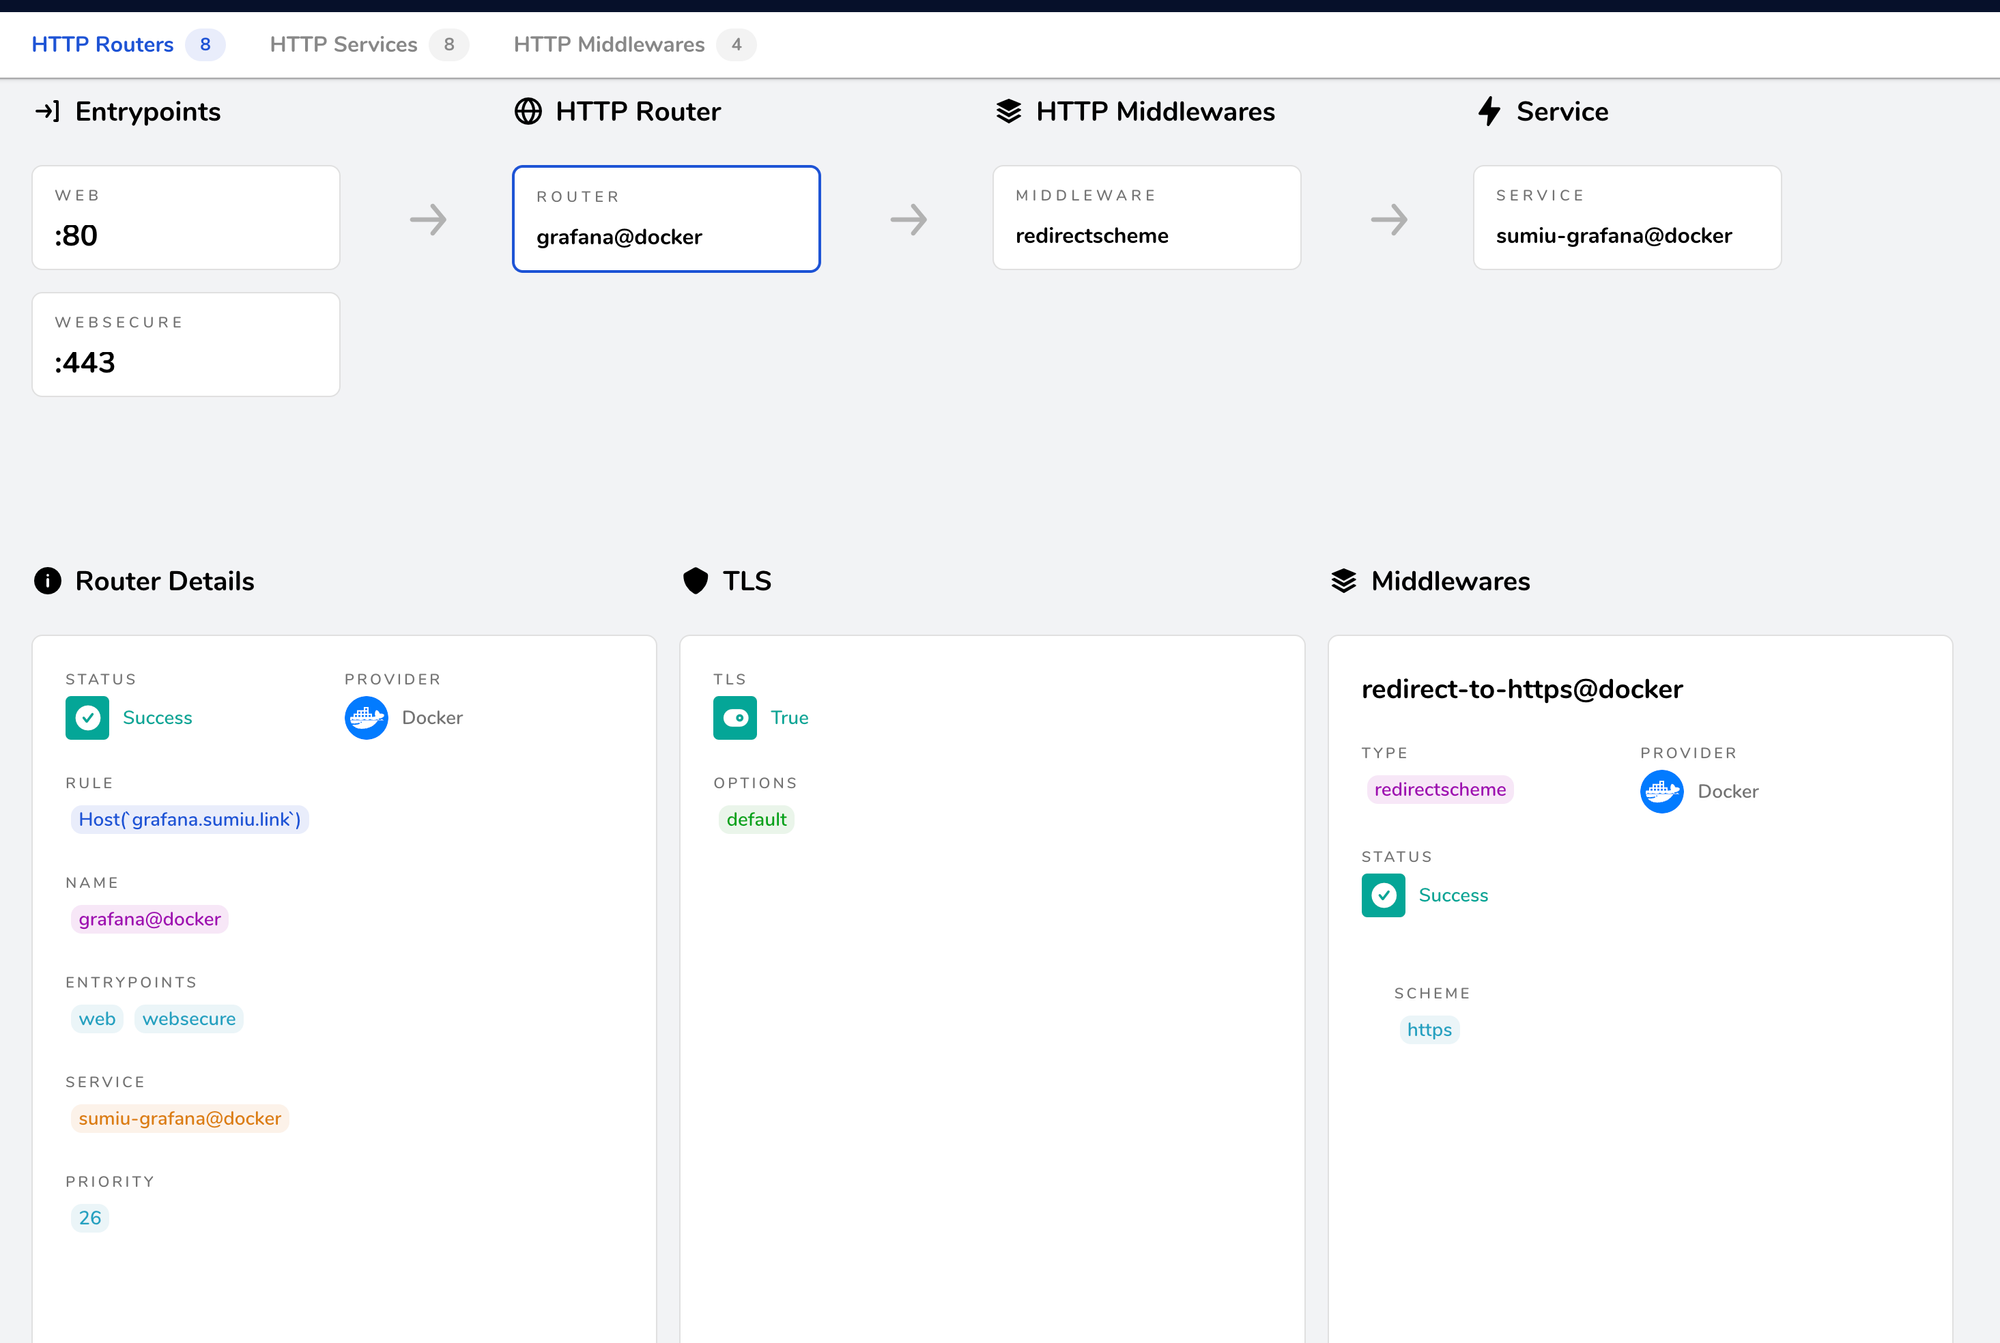
This tells me that "every request on 443, where the host is grafana.sumiu.link should be handled by sumiu-grafana service."
I'm talking a lot about Grafana here, but I haven't yet shown the settings for it, so here it is:
grafana:
  image: grafana/grafana-enterprise
  host: web
  env:
    clear:
      GF_SERVER_ROOT_URL: https://grafana.sumiu.link
      GF_INSTALL_PLUGINS: grafana-clock-panel,grafana-simple-json-datasource
  labels:
    traefik.enable: true
    traefik.http.routers.grafana.rule: Host(`grafana.sumiu.link`)
    traefik.http.routers.grafana.service: sumiu-grafana@docker
    traefik.http.routers.grafana.middlewares: redirect-to-https
    traefik.http.routers.grafana.tls: true
    traefik.http.middlewares.redirect-to-https.redirectscheme.scheme: https
  directories:
    - data/grafana:/var/lib/grafana
  options:
    user: 1000:1000
At this point, you will notice one thing: nowhere have I exposed any port. However, if you click on the service on the dashboard, you will notice that the port IS there:
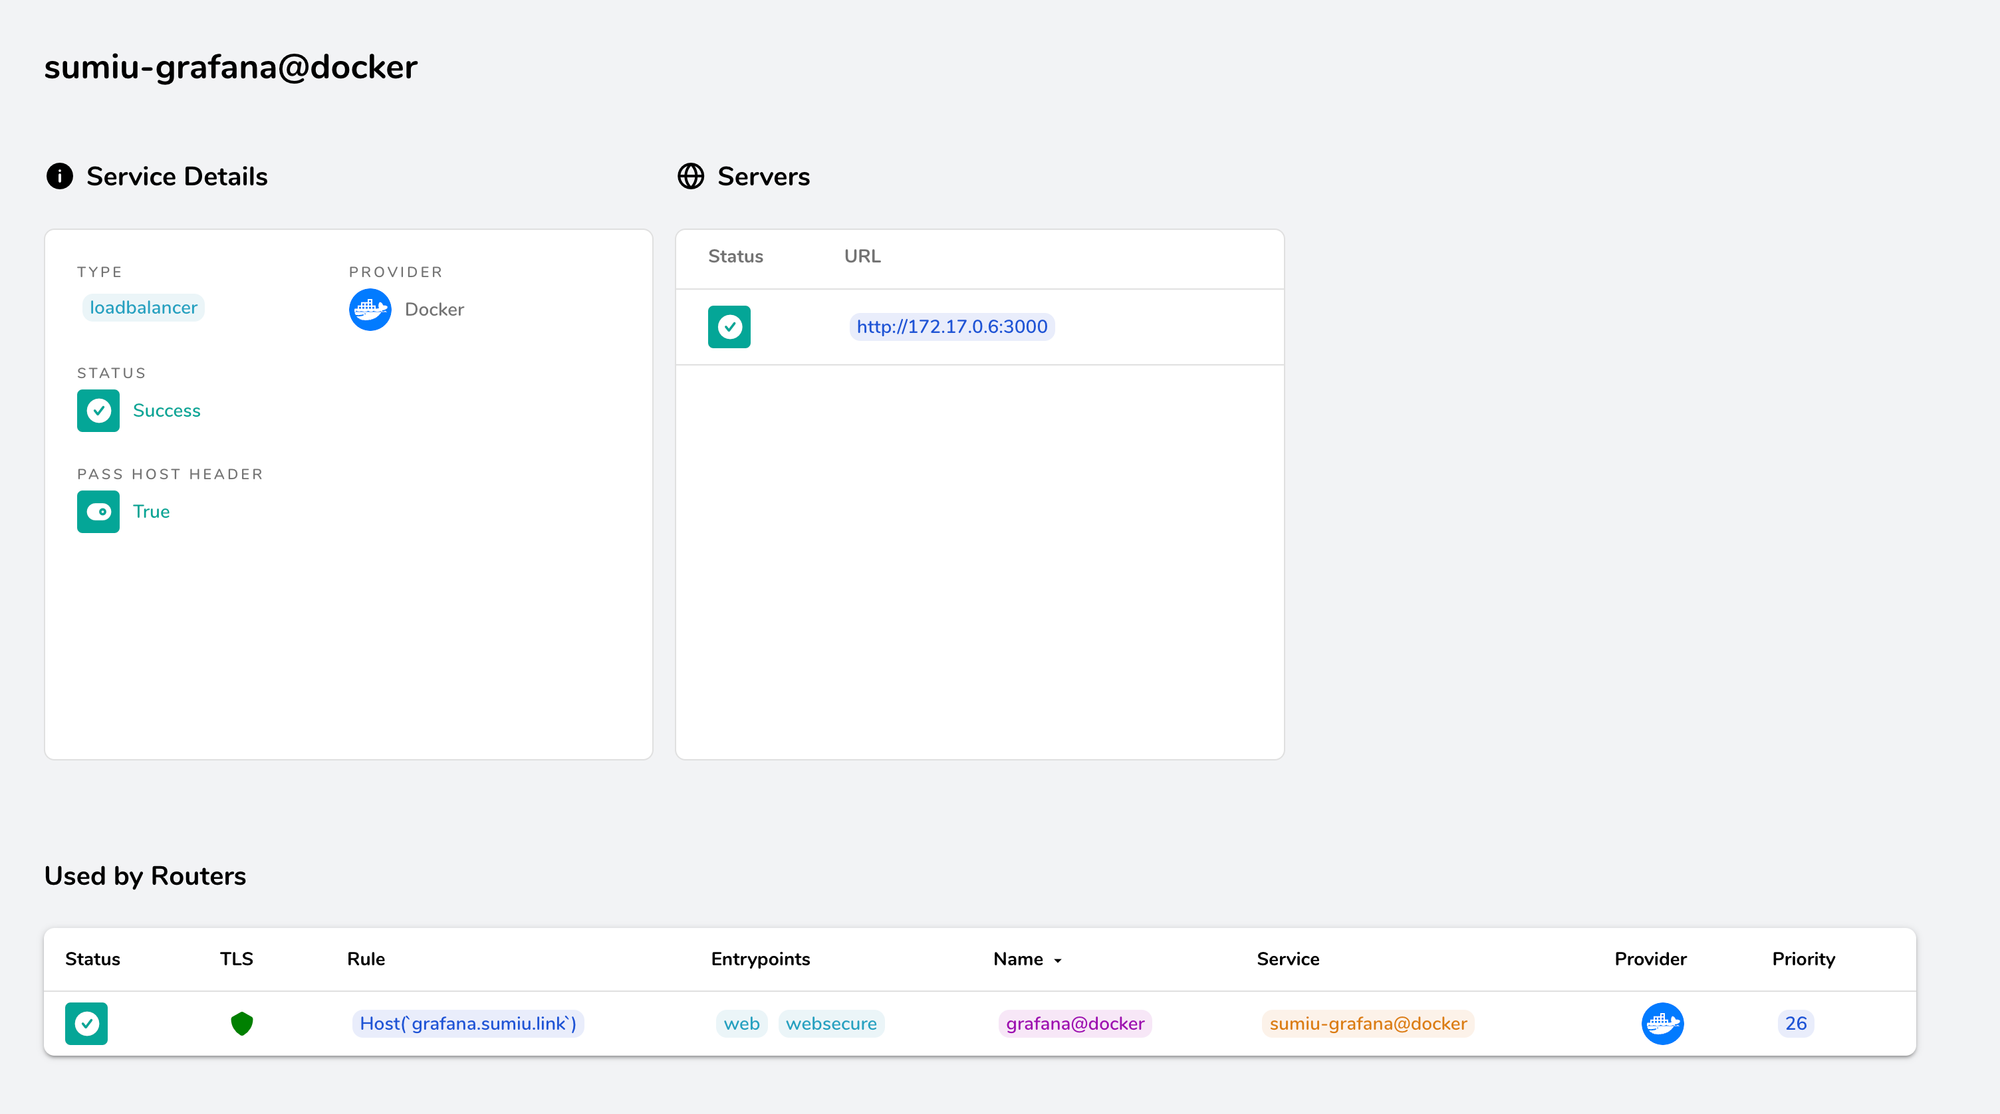
Traefik has privileged access to Docker so it can see which ports are open. Since we are only opening one port (well, not we, but Grafana exposes it), it will redirect traffic to this port.
Gotchas
If your service will expose a dashboard or anything like that, you are going to have to deploy it on the web role. Traefik is not accessible on accessory so the rule is "if Traefik needs to see it and route it, it goes on the web".
Grafana needs Prometheus. Since we don't expose Prometheus anywhere (I mean, there's no dashboard to expose anyway), it can go on accessory , but the port needs to be exposed so it can be accessed by Grafana:
prometheus:
  image: prom/prometheus:latest
  host: accessories
  port: 9090
  directories:
    - data/prometheus:/prometheus
  files:
    - infrastructure/prometheus/config.yml:/etc/prometheus/prometheus.yml
  options:
    user: 1000:1000
  cmd: --config.file=/etc/prometheus/prometheus.yml --storage.tsdb.path=/prometheus --storage.tsdb.retention.time=30d
I will follow up on how to own your infrastructure, including observability but first I need to explain these small details otherwise it would be a looong blog post.
I hope it helps, and let me know if there are other things I might have missed.
👋🏻